Execution
Contents
Execution
Module II
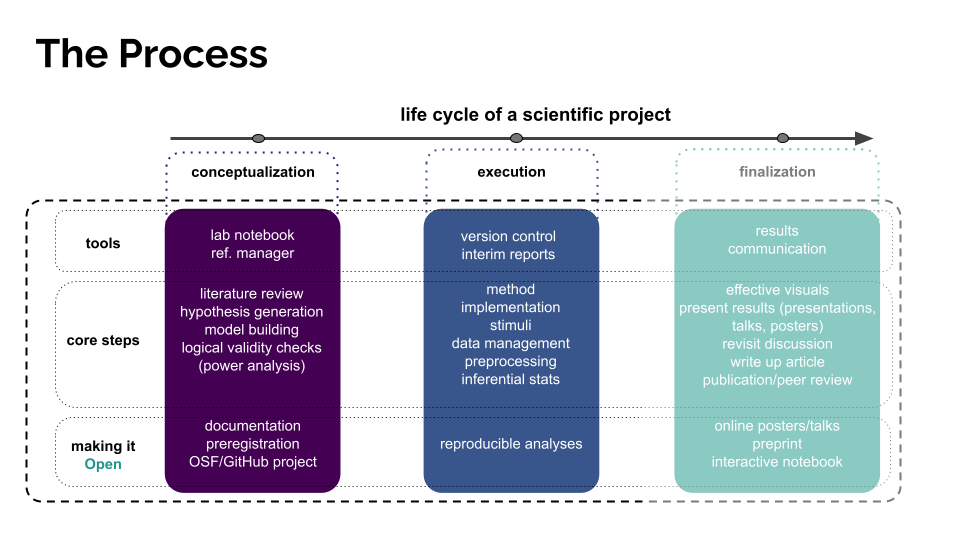
In the execution phase of our study, we worked on getting the experiment implemented (i.e. gathering and polishing our stimuli, writing our experiment code, getting ready to collect data from participants).
Implementation
We built our experiment using PsychoPy (written in Python & PsychoJS, a JavaScript library), which we rendered fully online using Pavlovia (a server for PsychoPy experiments). Thus, the scripts that run our experiment, all experiment components, and all raw data live in a single repository, the Repeated Recording Illusion/Pavlovia GitLab Repository (hereafter, the Pavlovia respository).
Stimuli
The stimuli we used for our experiment featured a song by the Beatles and a symphony by Anton Bruckner. The raw files we obtained as .mp4 files. However, the stimuli had to undergo some processing before we could use it.
The stimuli can be found in the project Pavlovia repository under materials/stimuli.
The original files (/originals) were converted to formats readable by the free software Praat (/converted). We then saved the clipped files (i.e. Beatles in full, Bruckner shortened to contain only last 2 mins 48 sec.) to their own clipped folder. Finally, we equalized the intensity to 71 dB SPL on both recordings as well as set both to the same sampling rate, 44100 (final).
Note
This page will be frequently updated. It will soon contain more links and information to help clarify some of the references to software, etc. Let your instructor know if you want anything in particular better explained!
Analysis
While the above-mentioned Pavlovia repository holds our raw data, we want a separate repository where we house our analysis scripts, and where we can save our “wrangled data” (if necessary), as well as figures, tables, and knitted .Rmd reports.
We created such a repository on GitHub for the project: Repated Recording Illusion/Analysis GitHub Repository (hereafter, analysis repository).
In this repository we will store the analysis for our data preprocessing, inferential stats, figures, etc. Since we will use R Markdown (.Rmd) files that will be publicly available, anyone should be able to follow our Data Management procedure to generate the same results.
Data Management
Alright, so now that we have all the components at hand, let’s get them on our local computers:
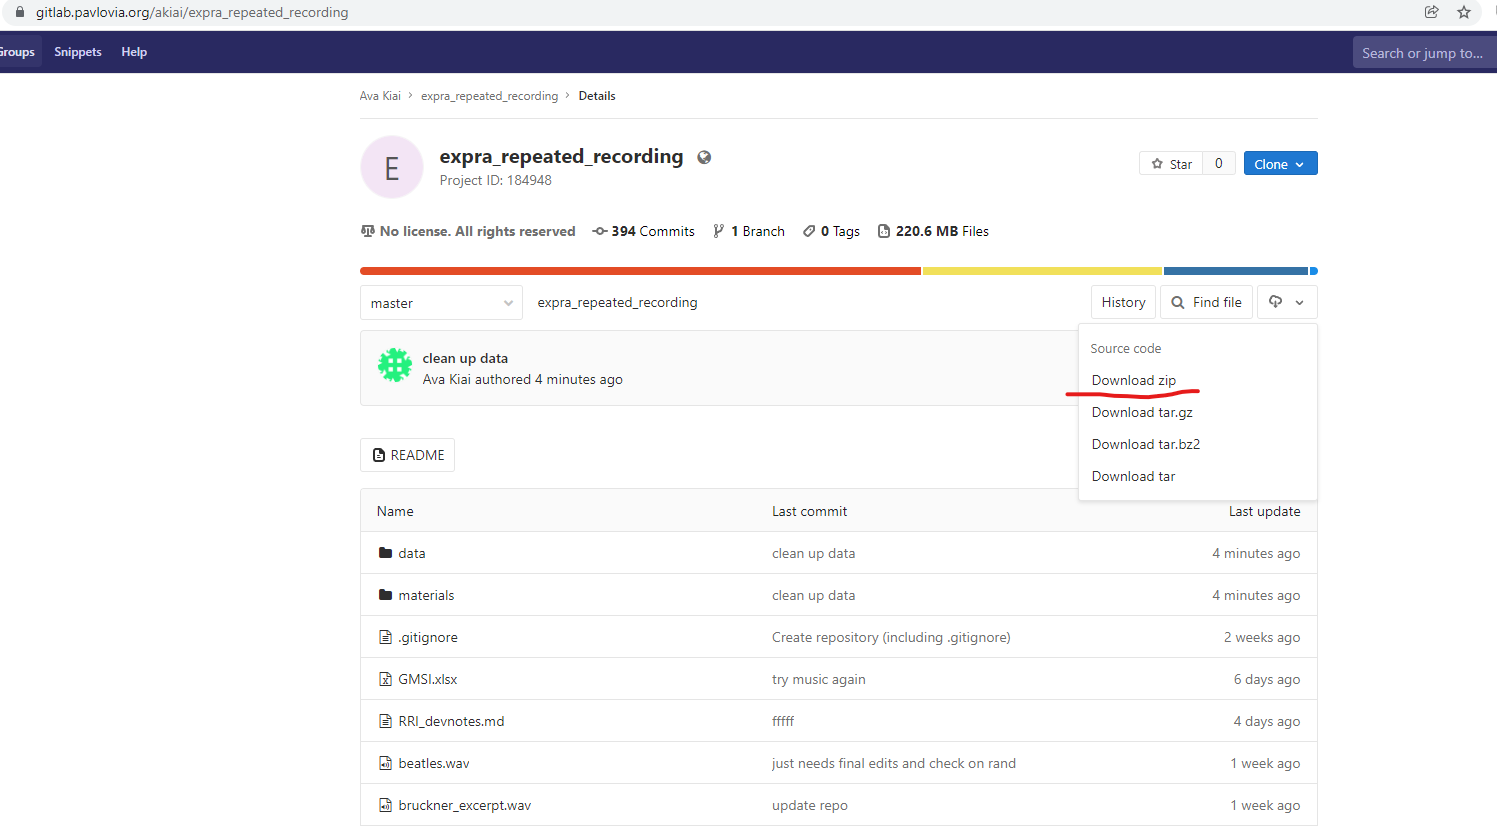
To download the raw data from the
Pavloviarepository, navigate to the main page of that repository, click on the little cloud icon and download the whole repository as a zip file. Export it to somewhere convenient.Important! For ease of reference, rename the folder
RRI_data_materials. (This is how we will refer to it in later scripts.)
To download our
analysisrepository, navigate to that repository, click onCodeand download the whole repository as a zip file. Be sure to export this folder to the same folder as you saved the data repository.Rename this folder
RRI_analysis.
Now, your folder structure should look something like this:
EXPRA/
|— RRI_data_materials/ (<– Here is where the Pavlovia repository lives.)
|— RRI_analysis/ (<– Here is where the analysis repository lives.)
Warning
Timestamping Your Partial Data Analysis & Keeping Your Data Folder Up To Date
Since we are beginning the process of analysis while data collection is still underway, you will need to download new data when we complete data collection. For now, as we are just getting our pipeline up and ready, it’s sufficient to work with partial data.
Timestamping: It is important that you note the date and time at which you downloaded the data. You can record this information either at the top of your script(s), or (preferably) in a separate text file in your analysis folder titled ‘readme.’
Stricltly speaking, “peeking at data” is discouraged and one should consider adding a penalty to your hypothesis tests in the form of a lower alpha criterion for significance. However, in our case we will be strict with ourselves and not change our analysis or collection protocol based on what we find. We are just getting ahead of the game.
Updating: The simplest way to sync your local data folder with the latest data (after data collection is complete) is to go to the Pavlovia repository and re-download only the RRI_data_materials/data folder. You can replace your old /data folder with the new one.
Get Fresh, Annotated Analysis As They Become Available!
As we work through analyses, I may update the scripts we use (sometimes with bug fixes, othertimes with solutions to coding problems). If you get a ping on Slack that a new script or new helper functions have been added, navigate to the analysis repository.
Helper Functions: The analysis/funs.R file, which contains helper functions, can just be replaced with the new one.
Scripts: New components or chunks added to analysis files can be incorporated into your scripts however you prefer. Make sure to clean up your workspace by deleteing any old or unused files and use consistent file naming protocols if you would like to keep multiple versions of a file. For example:
analysis_v1.Rmd
analysis_v2.Rmd
analysis_v3.Rmd
Data Check
Since our experiment features a between-subjects design, we implemented a feature in our experiment code that assigns participant to different groups based on the participant number and a randomly shuffled vector later in the experiment. This means an imbalance in participant distribution between conditions can occur. So, without looking at the data itself (i.e. the dependent variables), we can perform a quick check to make sure our data look ok:
To progress of our data collection and condition randomization, we use the file RRI_data_materials/materials/check_participation_progress.Rmd.
Along with a helper function in the adjacent .R file, this script allows us to calculate the number of complete data sets (and the participanat numbers), and which of those were assigned to the Working Memory condition (0 (no) or 1 (yes)), which saw which musical genre first (classical, rock or rock, classical), and which were presented with which order of explicit information or prestige suggestion (baseline, low, high vs. baseline, high, low).